
Using the Tabular editor to create multiple DAX measures fast

Recently, my job required me to create 60 DAX-measures in the same report. We had to calculate and show 20 fields in 3 different ways.
Since creating 60 DAX-measures manually would be quite slow and monotonous, I looked for a faster solution online. This led me to a program called Tabular editor. A popular tool designed to ease the development and management of Tabular models, which are used for data modeling, calculations, and reporting in business intelligence solutions like Power BI and Azure Analysis Services.
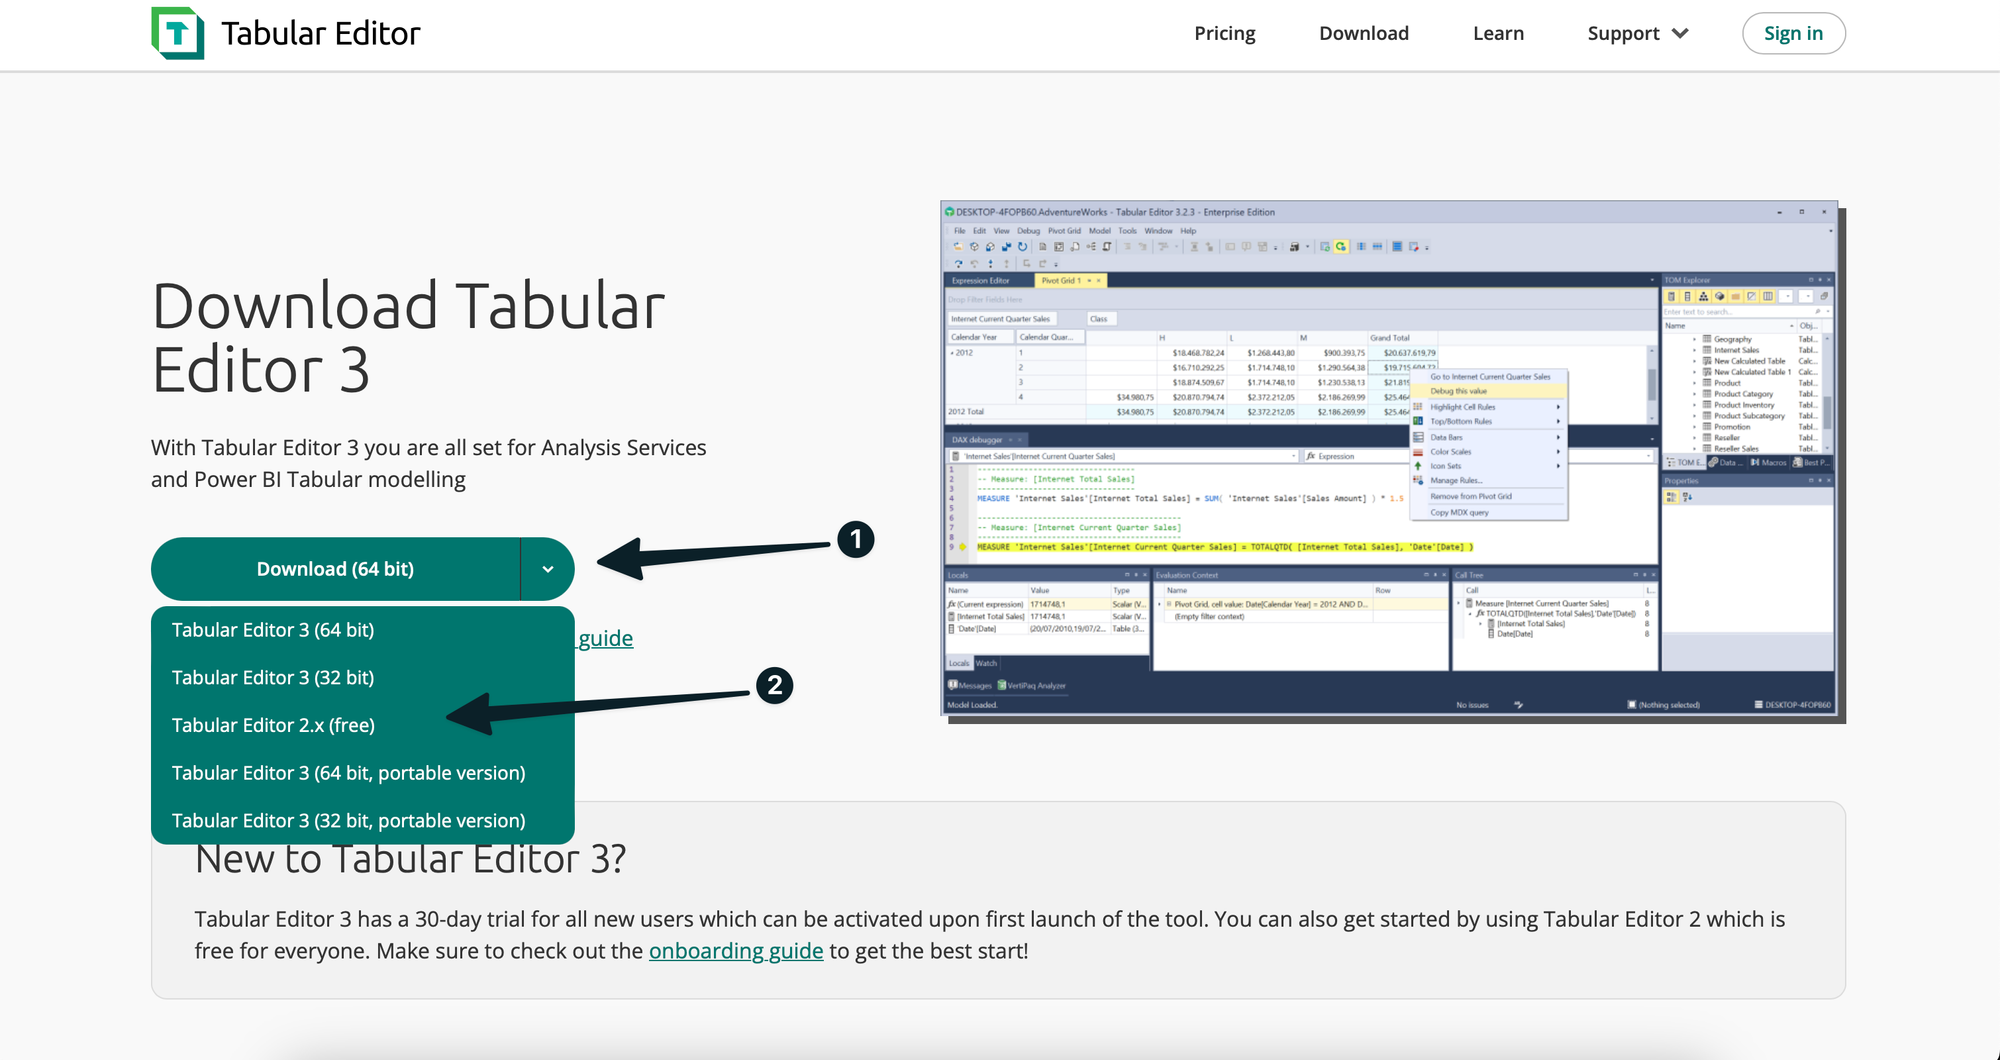
A free version of this program can be downloaded from the official website, here.
After following the installation wizard and sucesfully having installed the program, open the Power BI report you'd like to create the measures in. I'll open a simple blank report with and import the following dataset containing 4 columns I'd like to create 8 measures for in total.


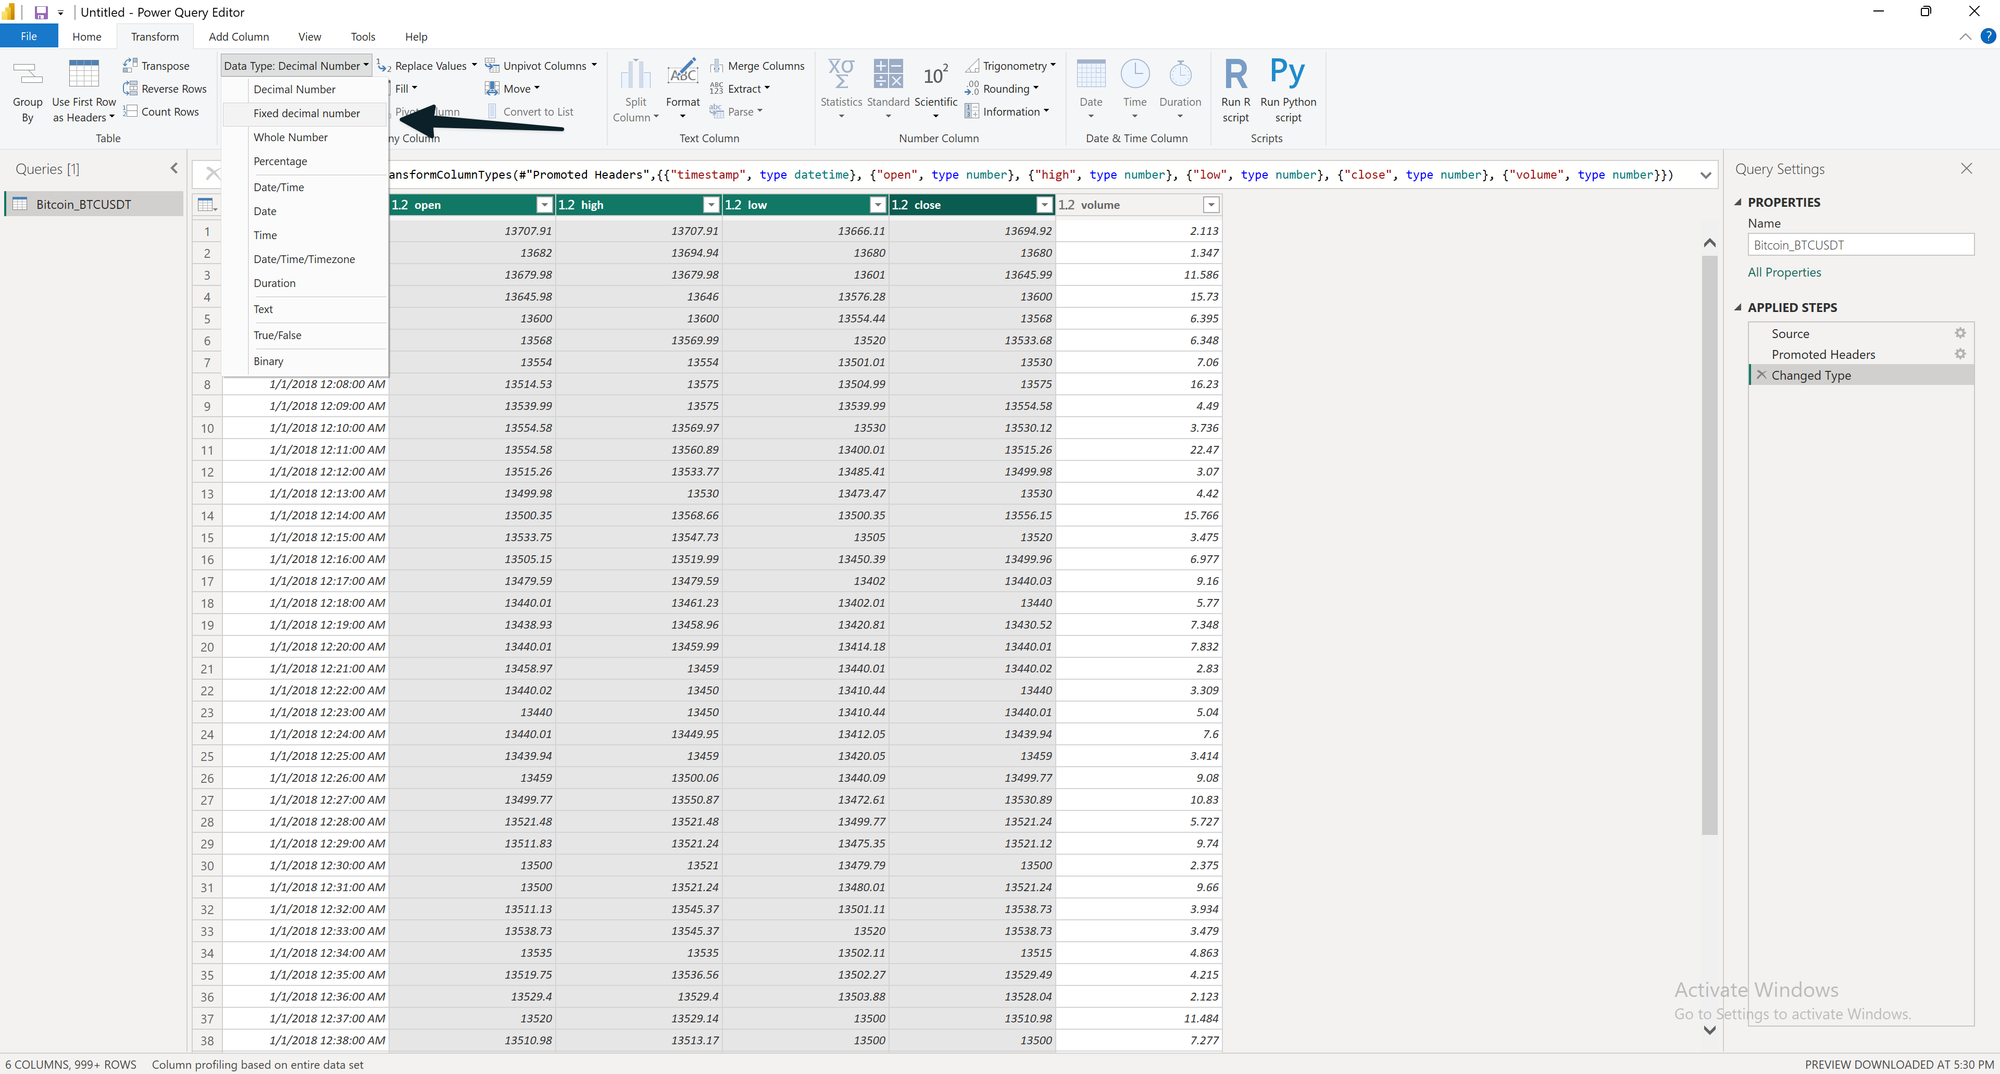
The dataset basically contains information about the Bitcoin price in US dollars for every minute after januari 1st 2018.
For all of these minutes, we have the opening, closing, highest and lowest price in USD. We'll give these columns fixed decimal number data types after importing them to Power Query:
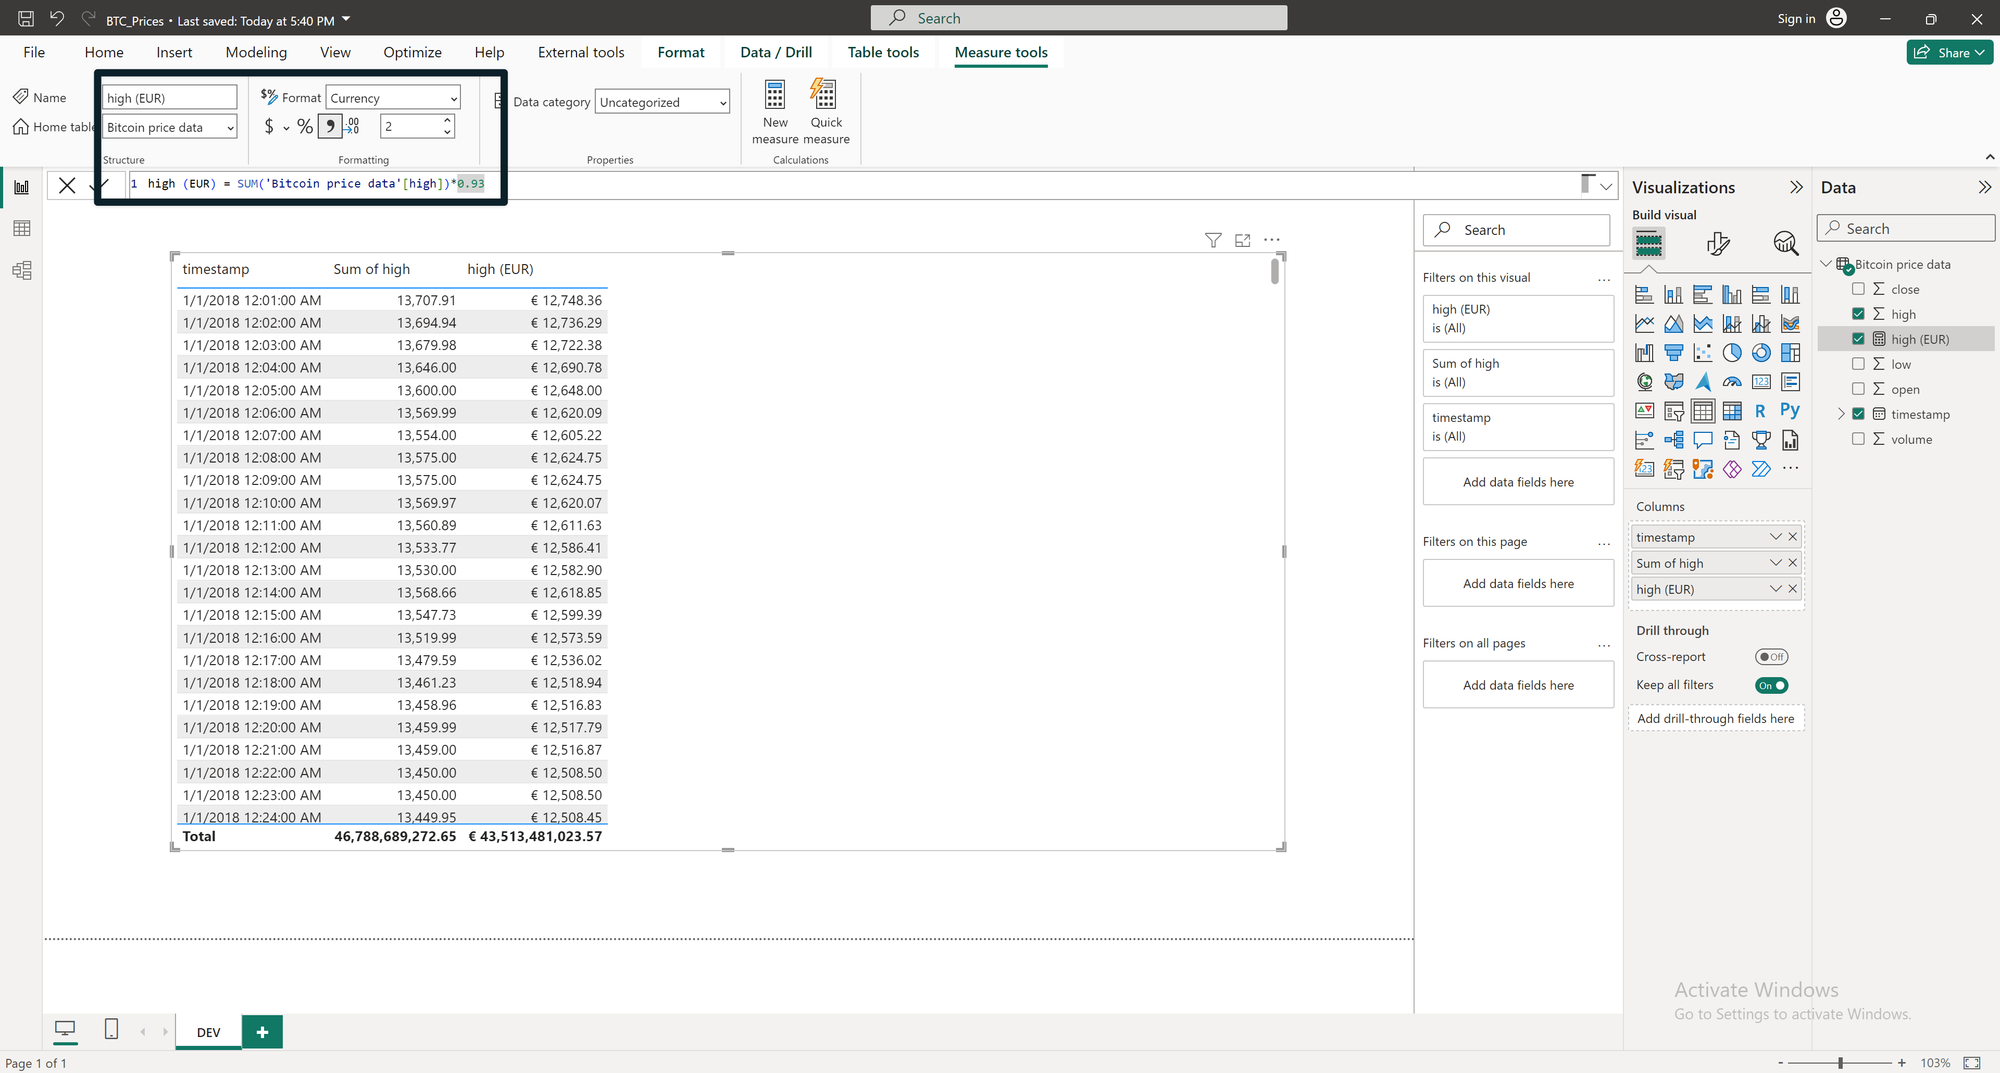
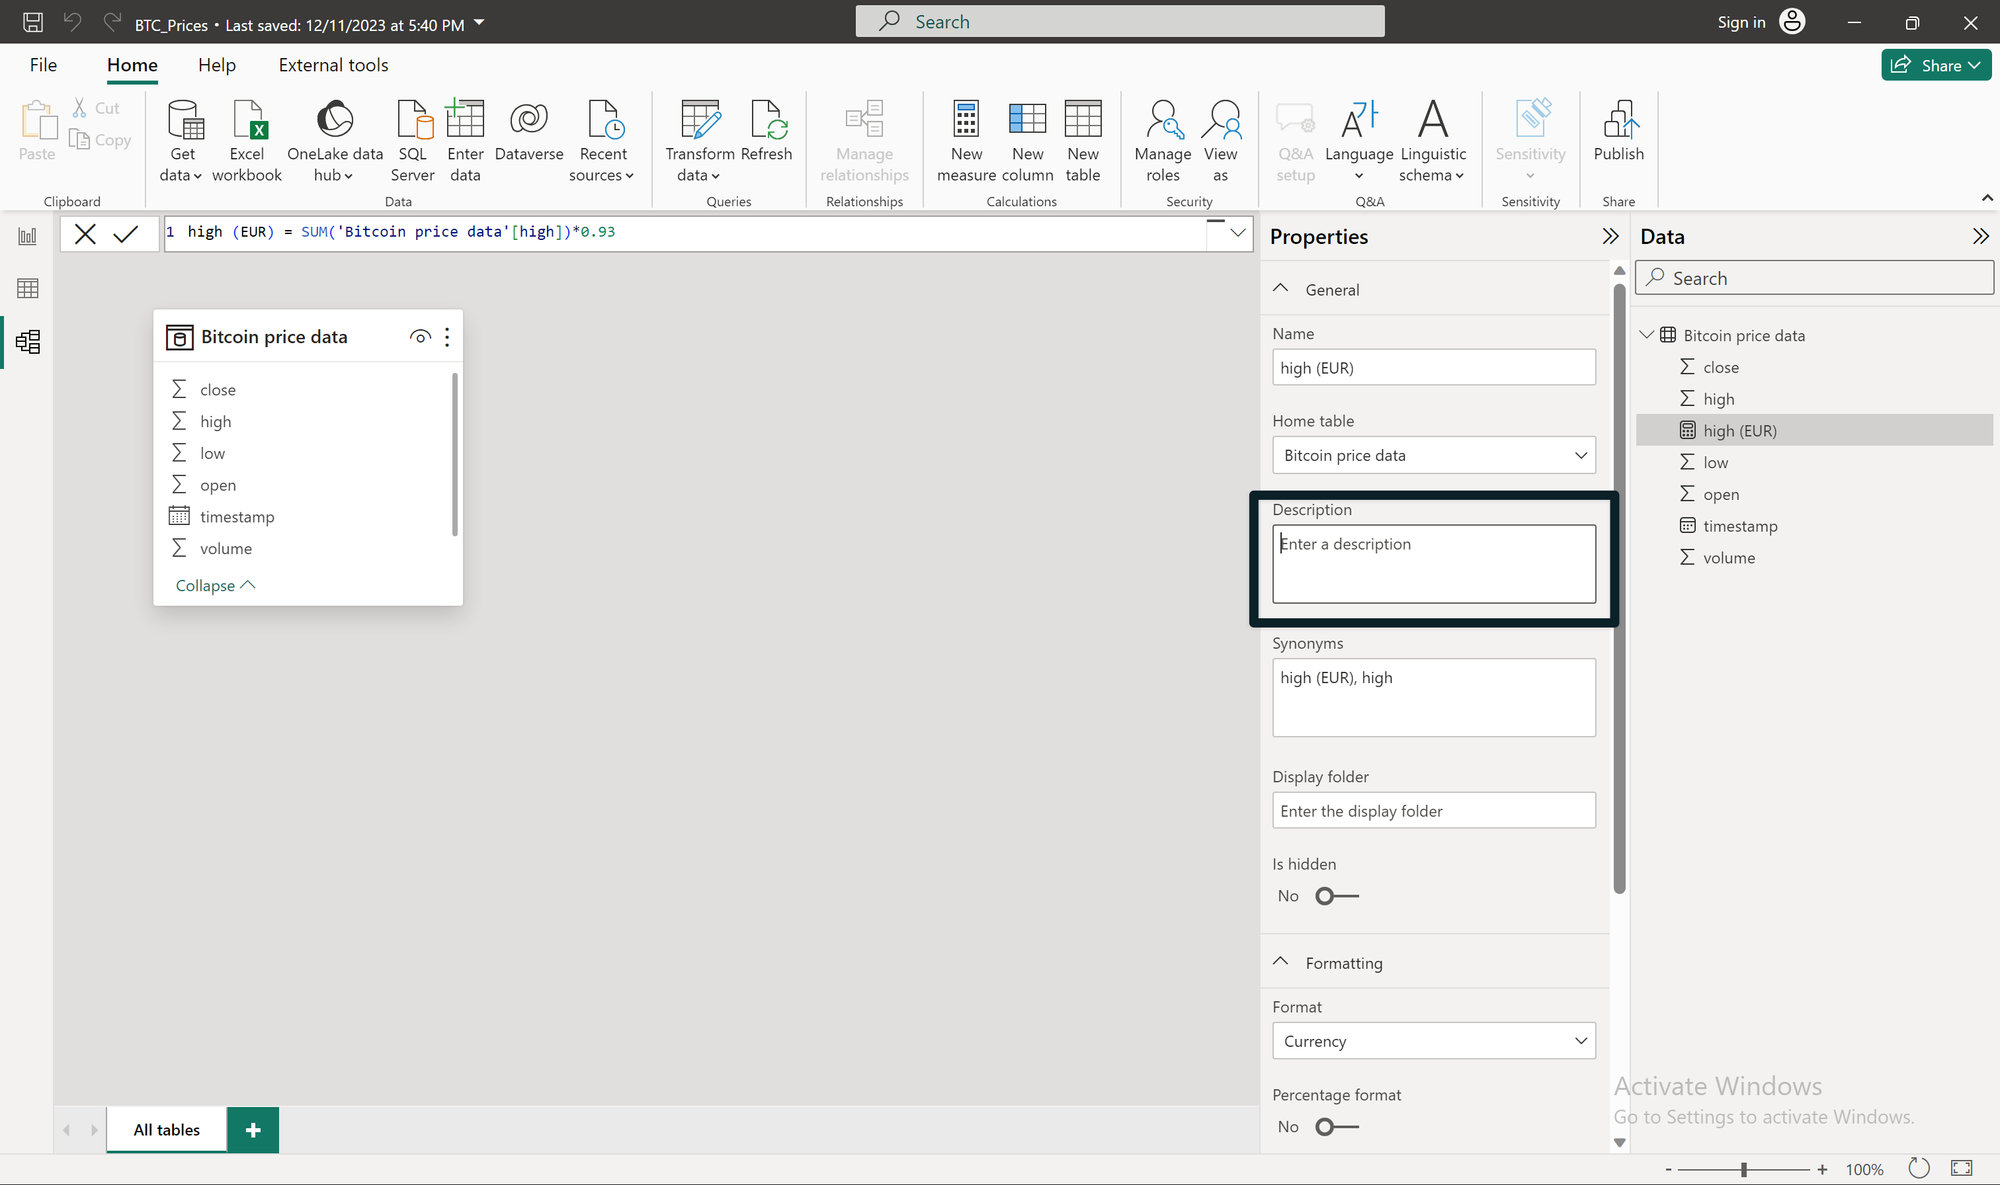
Next I'd like to create two sample DAX measure which I want to use in my tabular editor code, which we'll create later.
First of all I'd like to convert the usd amount to euro's, in a measure. We do this by multiplying the USD amount with 0.93, like this:
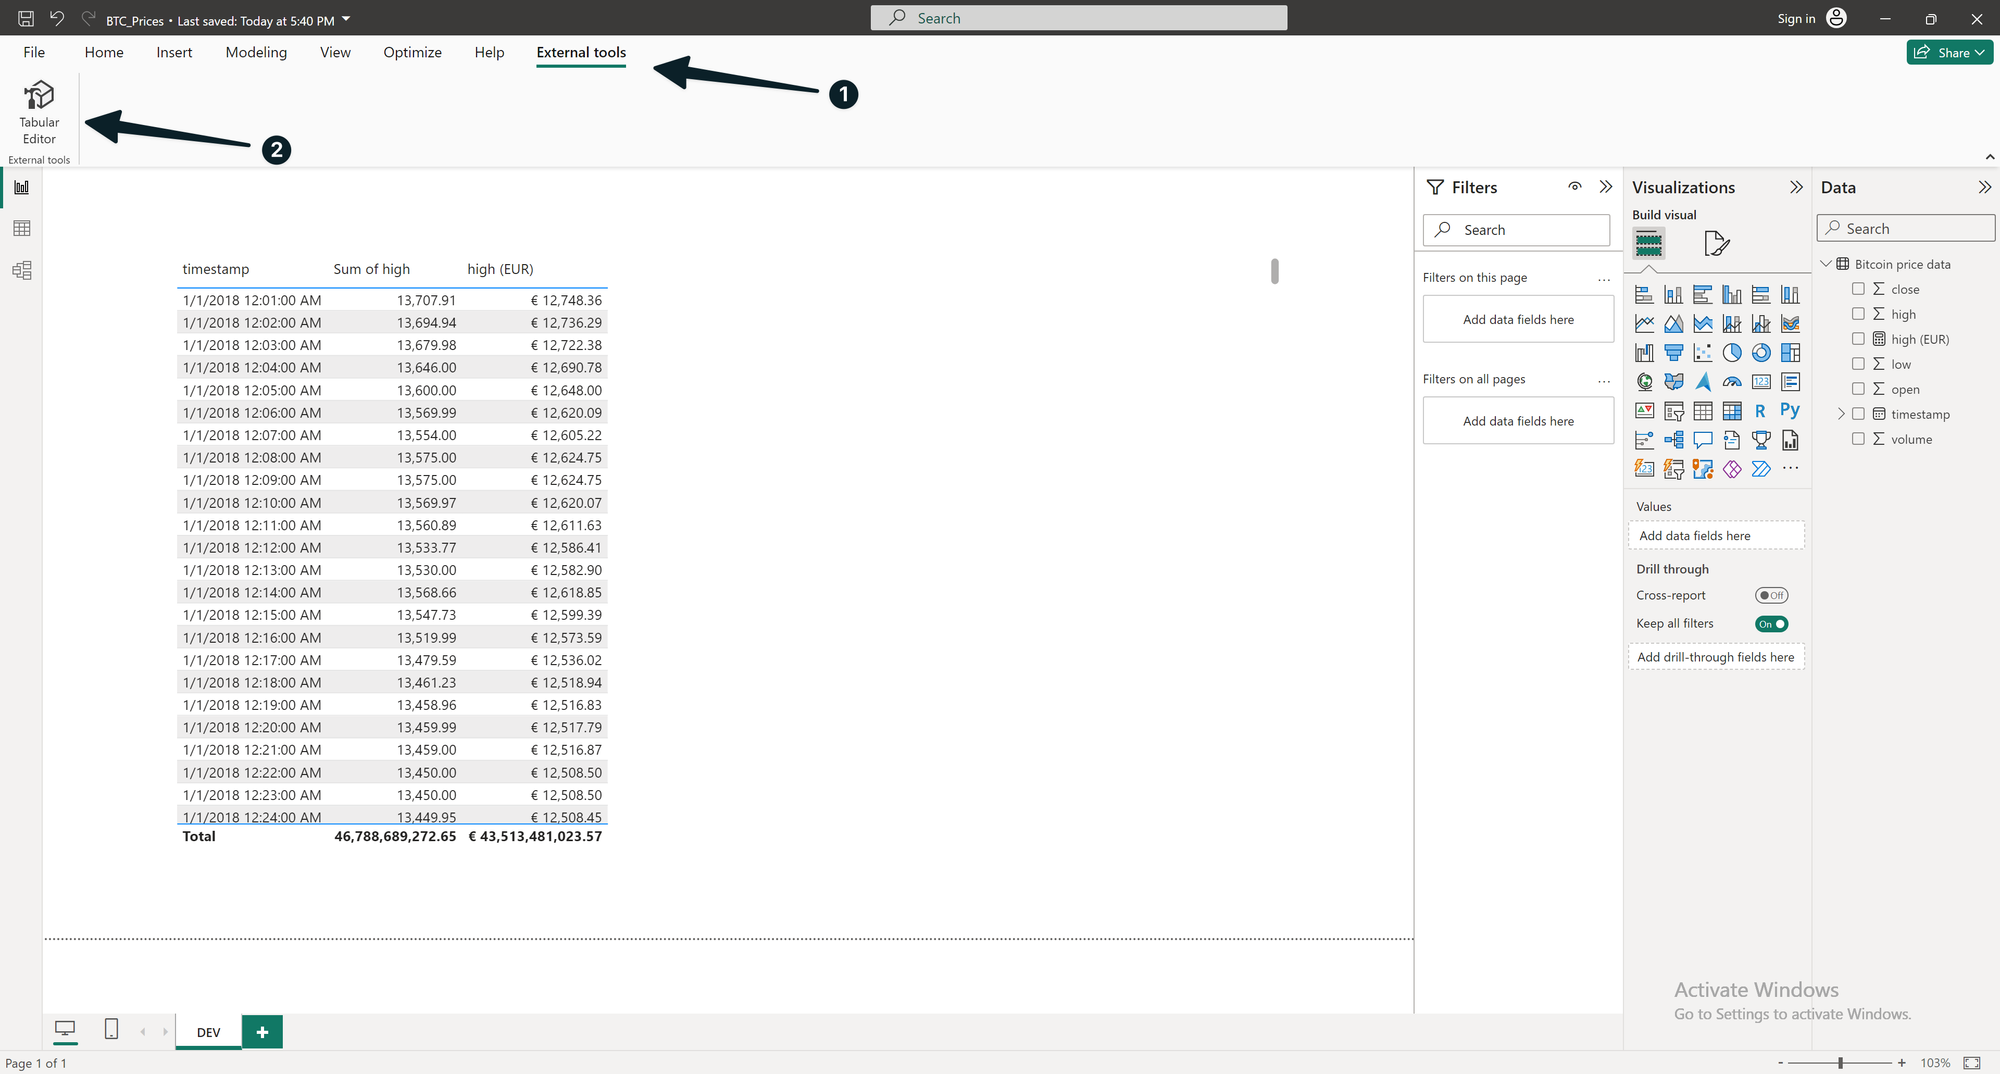
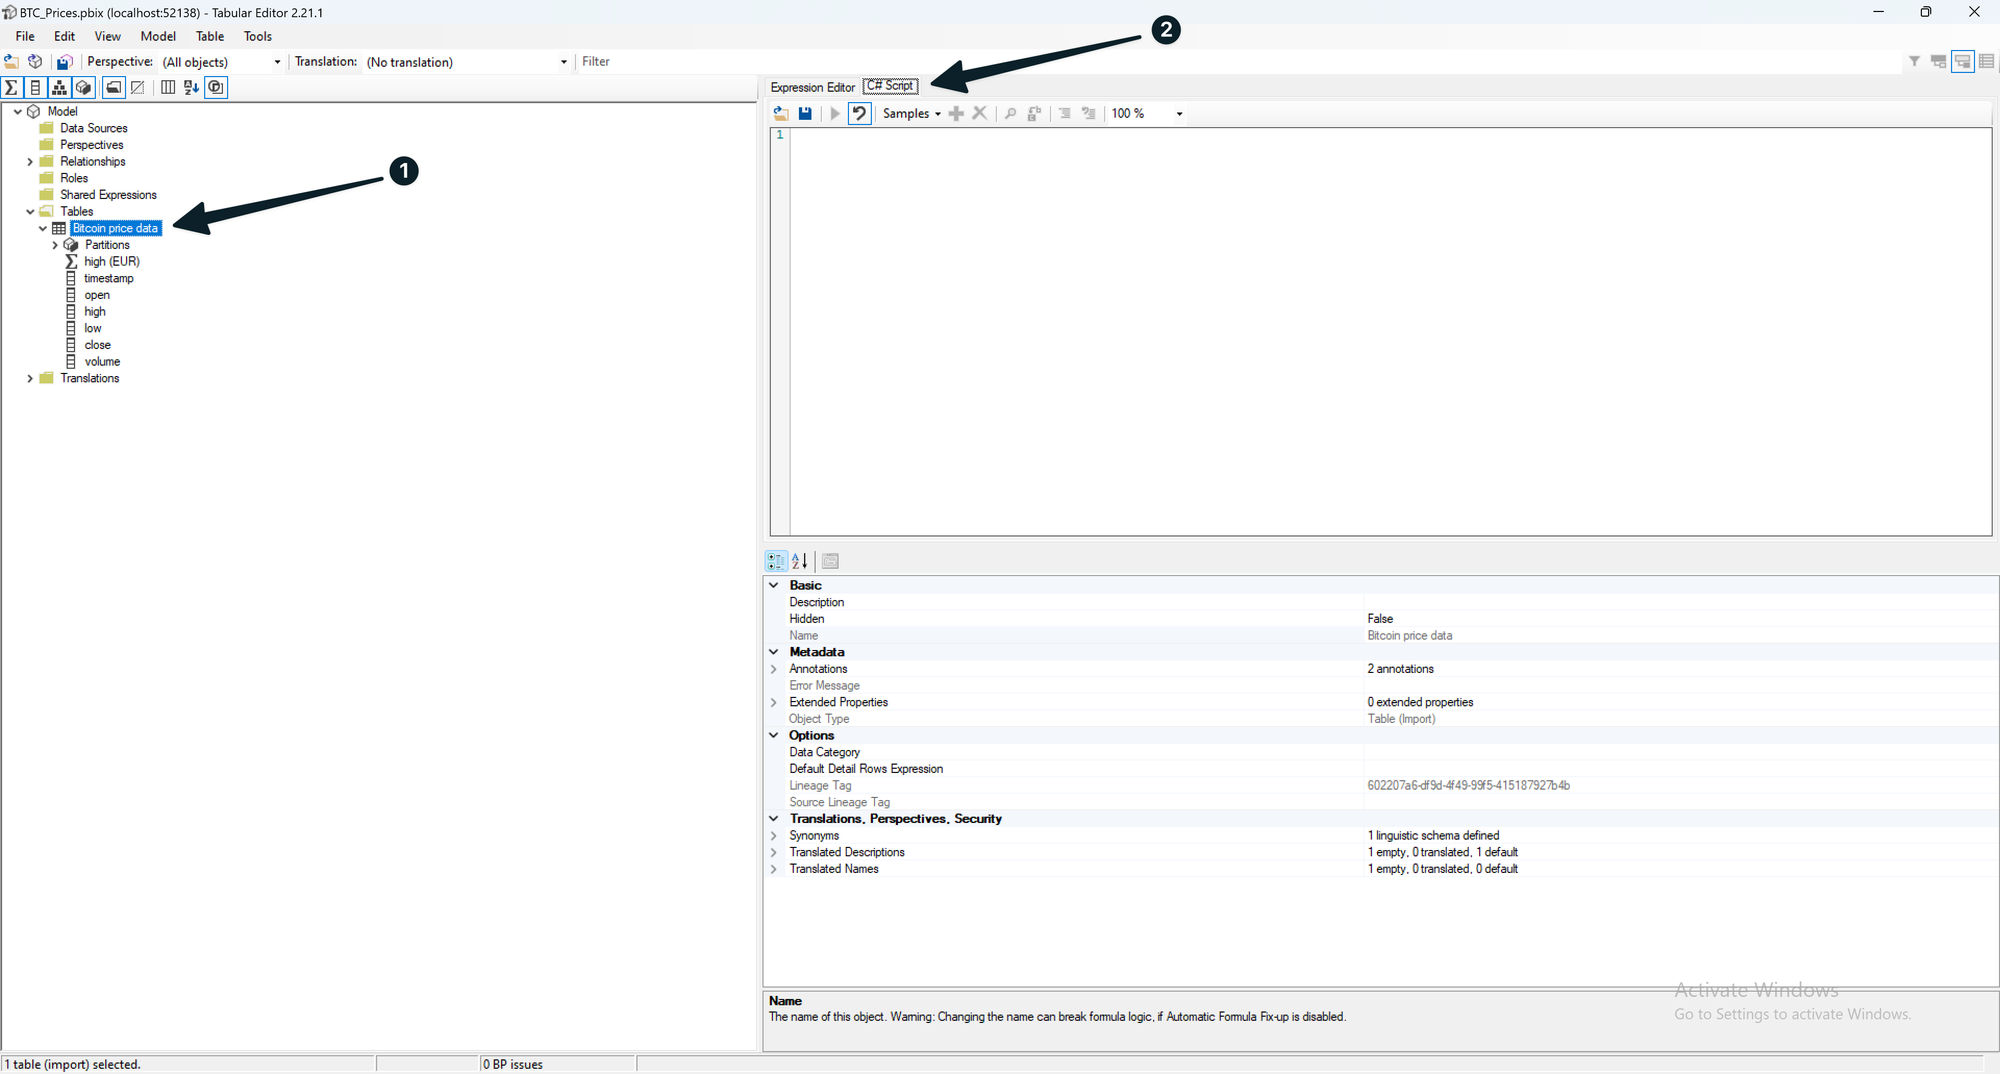
After making sure this DAX code works, let's continue and open the Tabular Editor. After installing the program, it should appear in the "External tools" ribbon.
Next we'd like to create a measure that convert the USD amount to Great Britain Pounds by multiplying the USD amount with 0.80.
After opening it, select our BTC Price data table and the press "C# Script".
It's now time to write some code. I used an example from the official tabular editor documentation to help me use the right syntax:

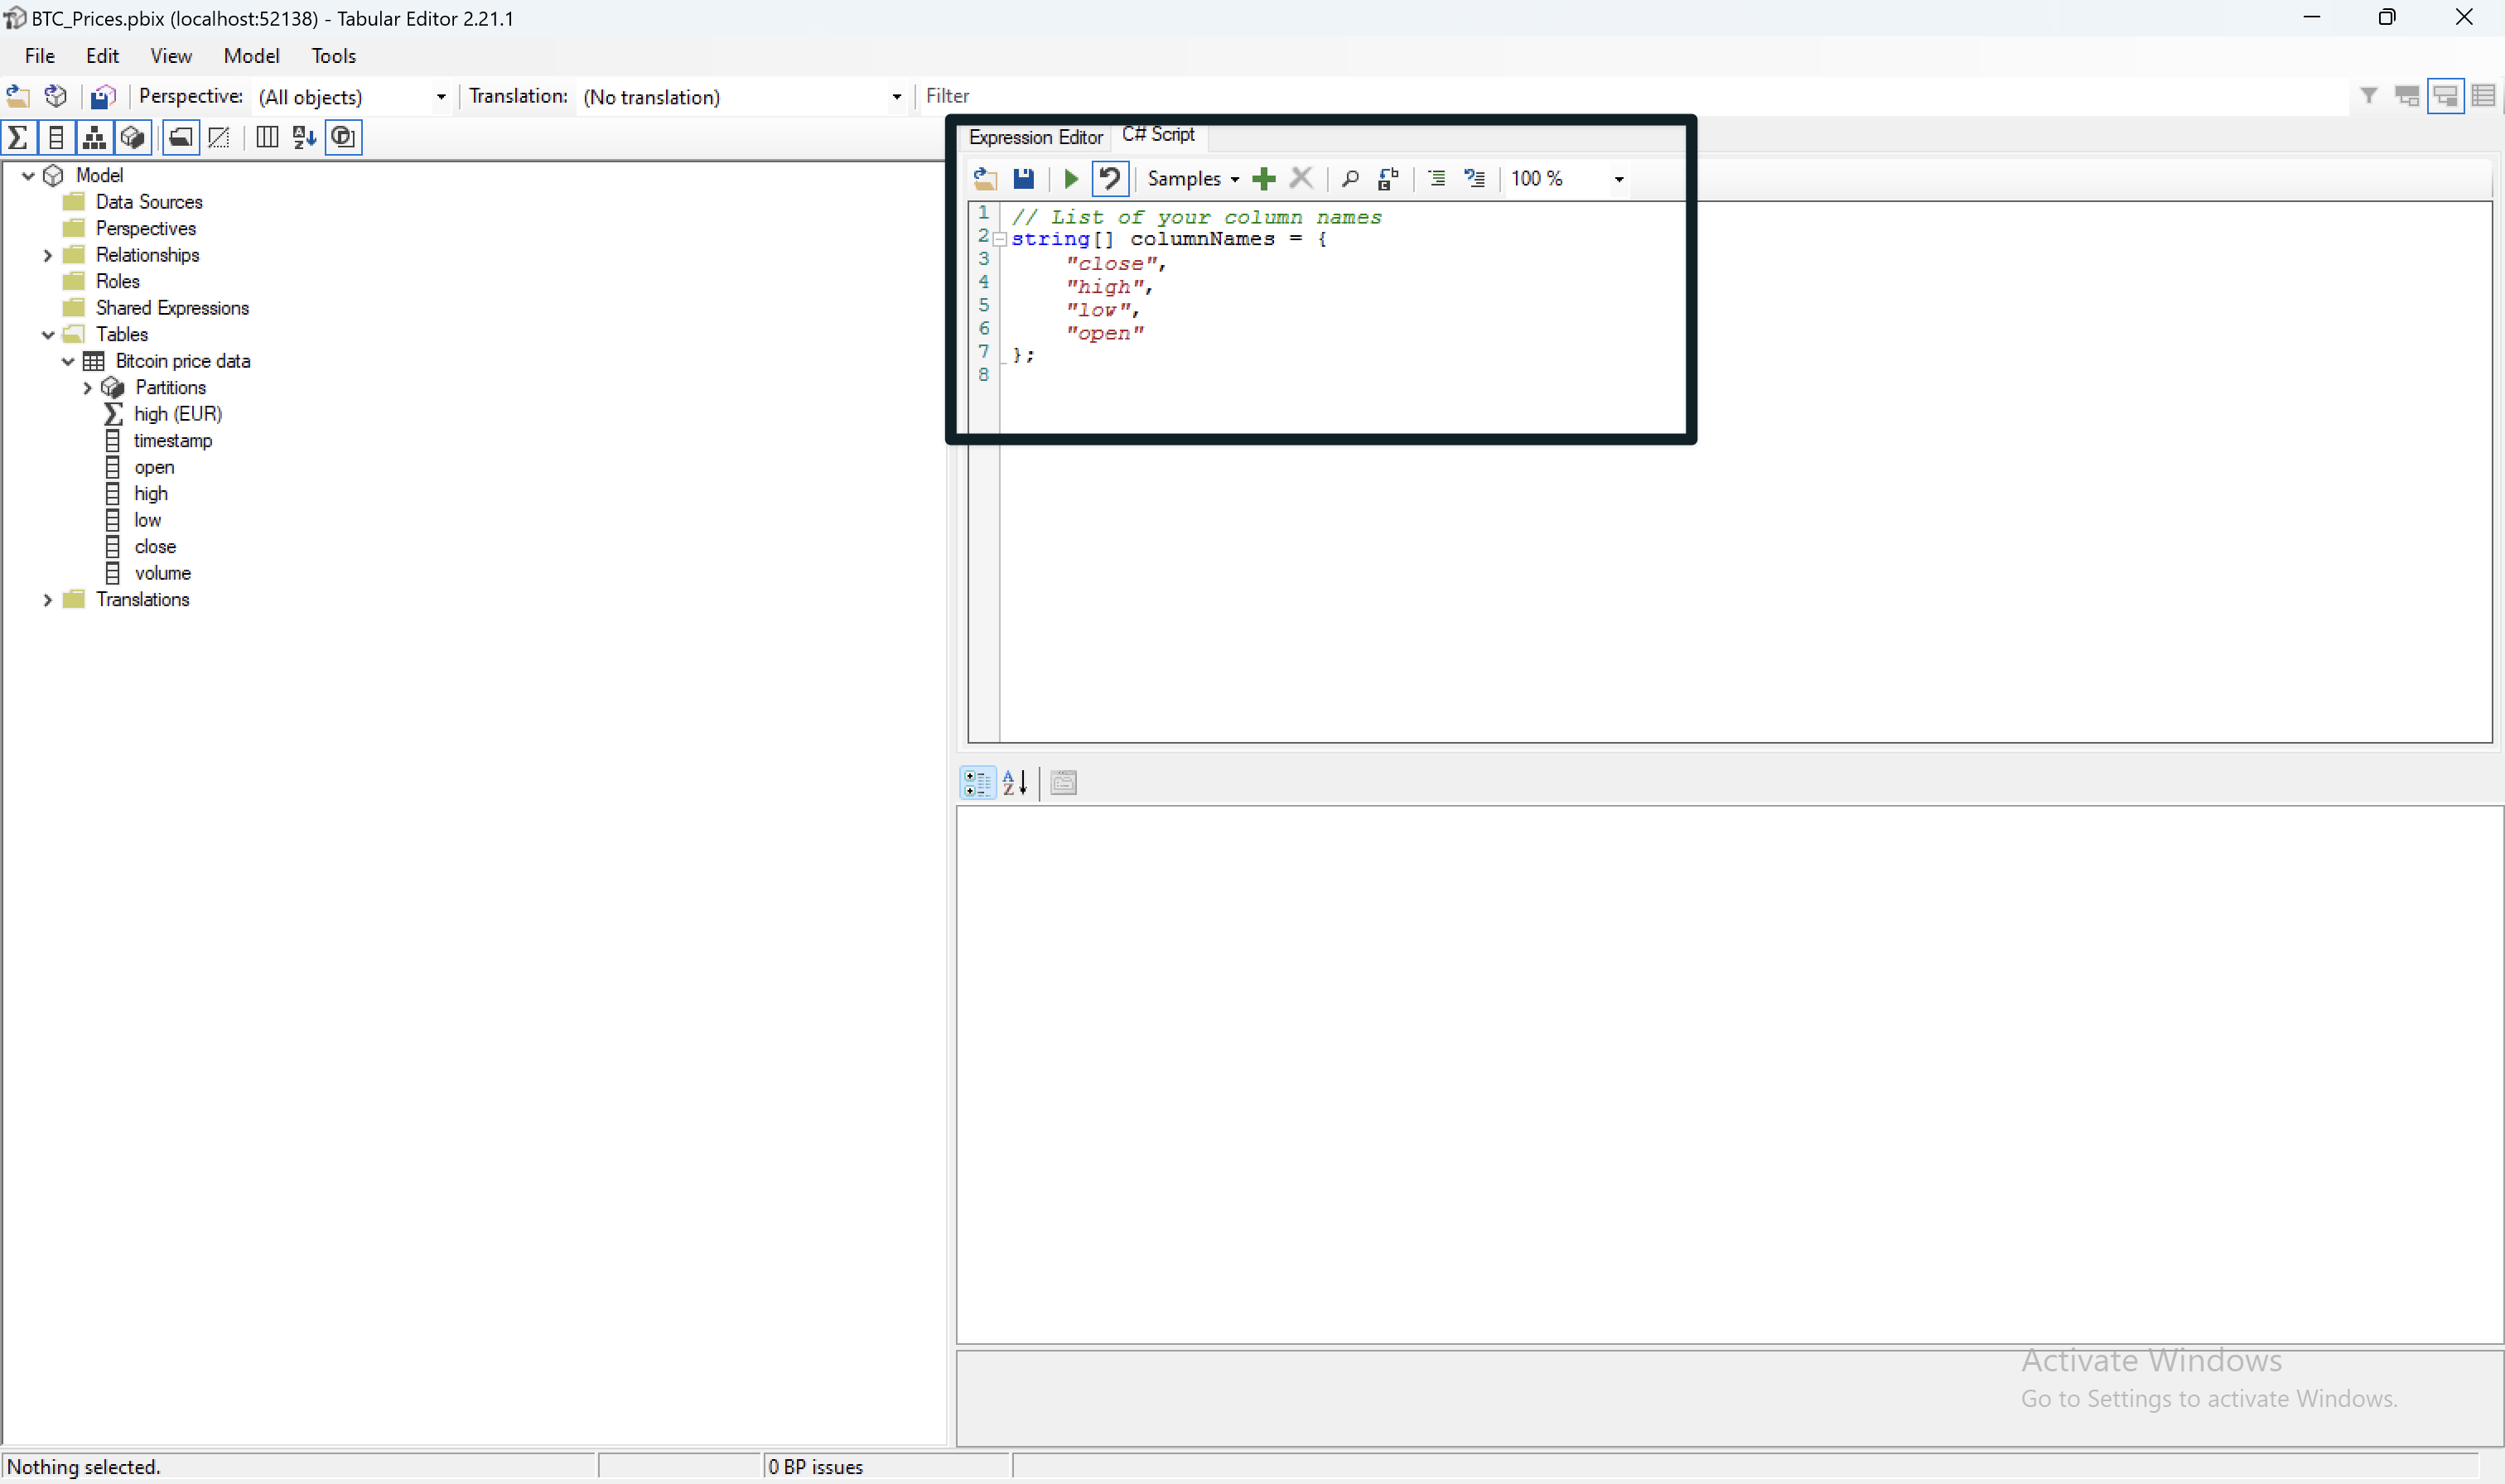
Start typing a list containing your column names:
// List of your column names
string[] columnNames = {
    "close",
    "high",
    "low",
    "open"
};
This tells the later parts of our script which columns we want to use:
We now have to start a loop that cycles through all of these columns. In order to do this, we first have to specify our table name and point the loop towards our column names:
foreach (var columnName in columnNames) {
    var table = Model.Tables["Bitcoin price data"];
    var column = table.Columns[columnName];
After doing this, we want to tell the Tabular what measure we want to create. Do this by specifying a name and a sample measure. Note that the "columName" variable is a column name from the list we created earlier.
var measureName = "# EURO FORMATTED - " + columnName;
    var daxFormula = "SUM('" + table.Name + "'[" + columnName + "]) * 0.93";

    var newMeasure = table.AddMeasure(
        measureName,
        daxFormula,
        "EURO - FORMATTING"      // Display folder for the new measure
    );
The code above creates a new folder to place the measures into, it's called "EURO - FORMATTING". Leave this empty when you don't want to use folders. I do recommend them when creating multiple measures.
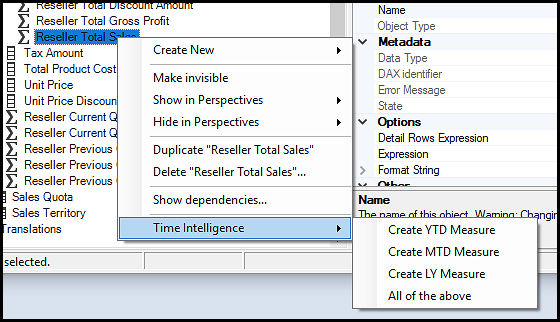
We're now almost done. Let's finish by specifying the formatting of our measures results. You'd normally do that here:
Type the following code below your existing code. We first specify the EURO formatting and then create a description for our messages:
    newMeasure.FormatString = "€#,0.00";
    newMeasure.Description = "2023.12.13-DR: Created measure"; // Documentation
}
These two blogs share more possible output formats:
- https://www.ganjingworld.com/news/tabular-editor-formatting/1g797apn38b1FN3AJC5atTkah1kg1c
- https://dataempower.net/formatting-string-calculated-item-tabular-editor-powerbi/
You'd normally create a description here, if you ever use them at all:
Our code is now complete. this is how it should look like:
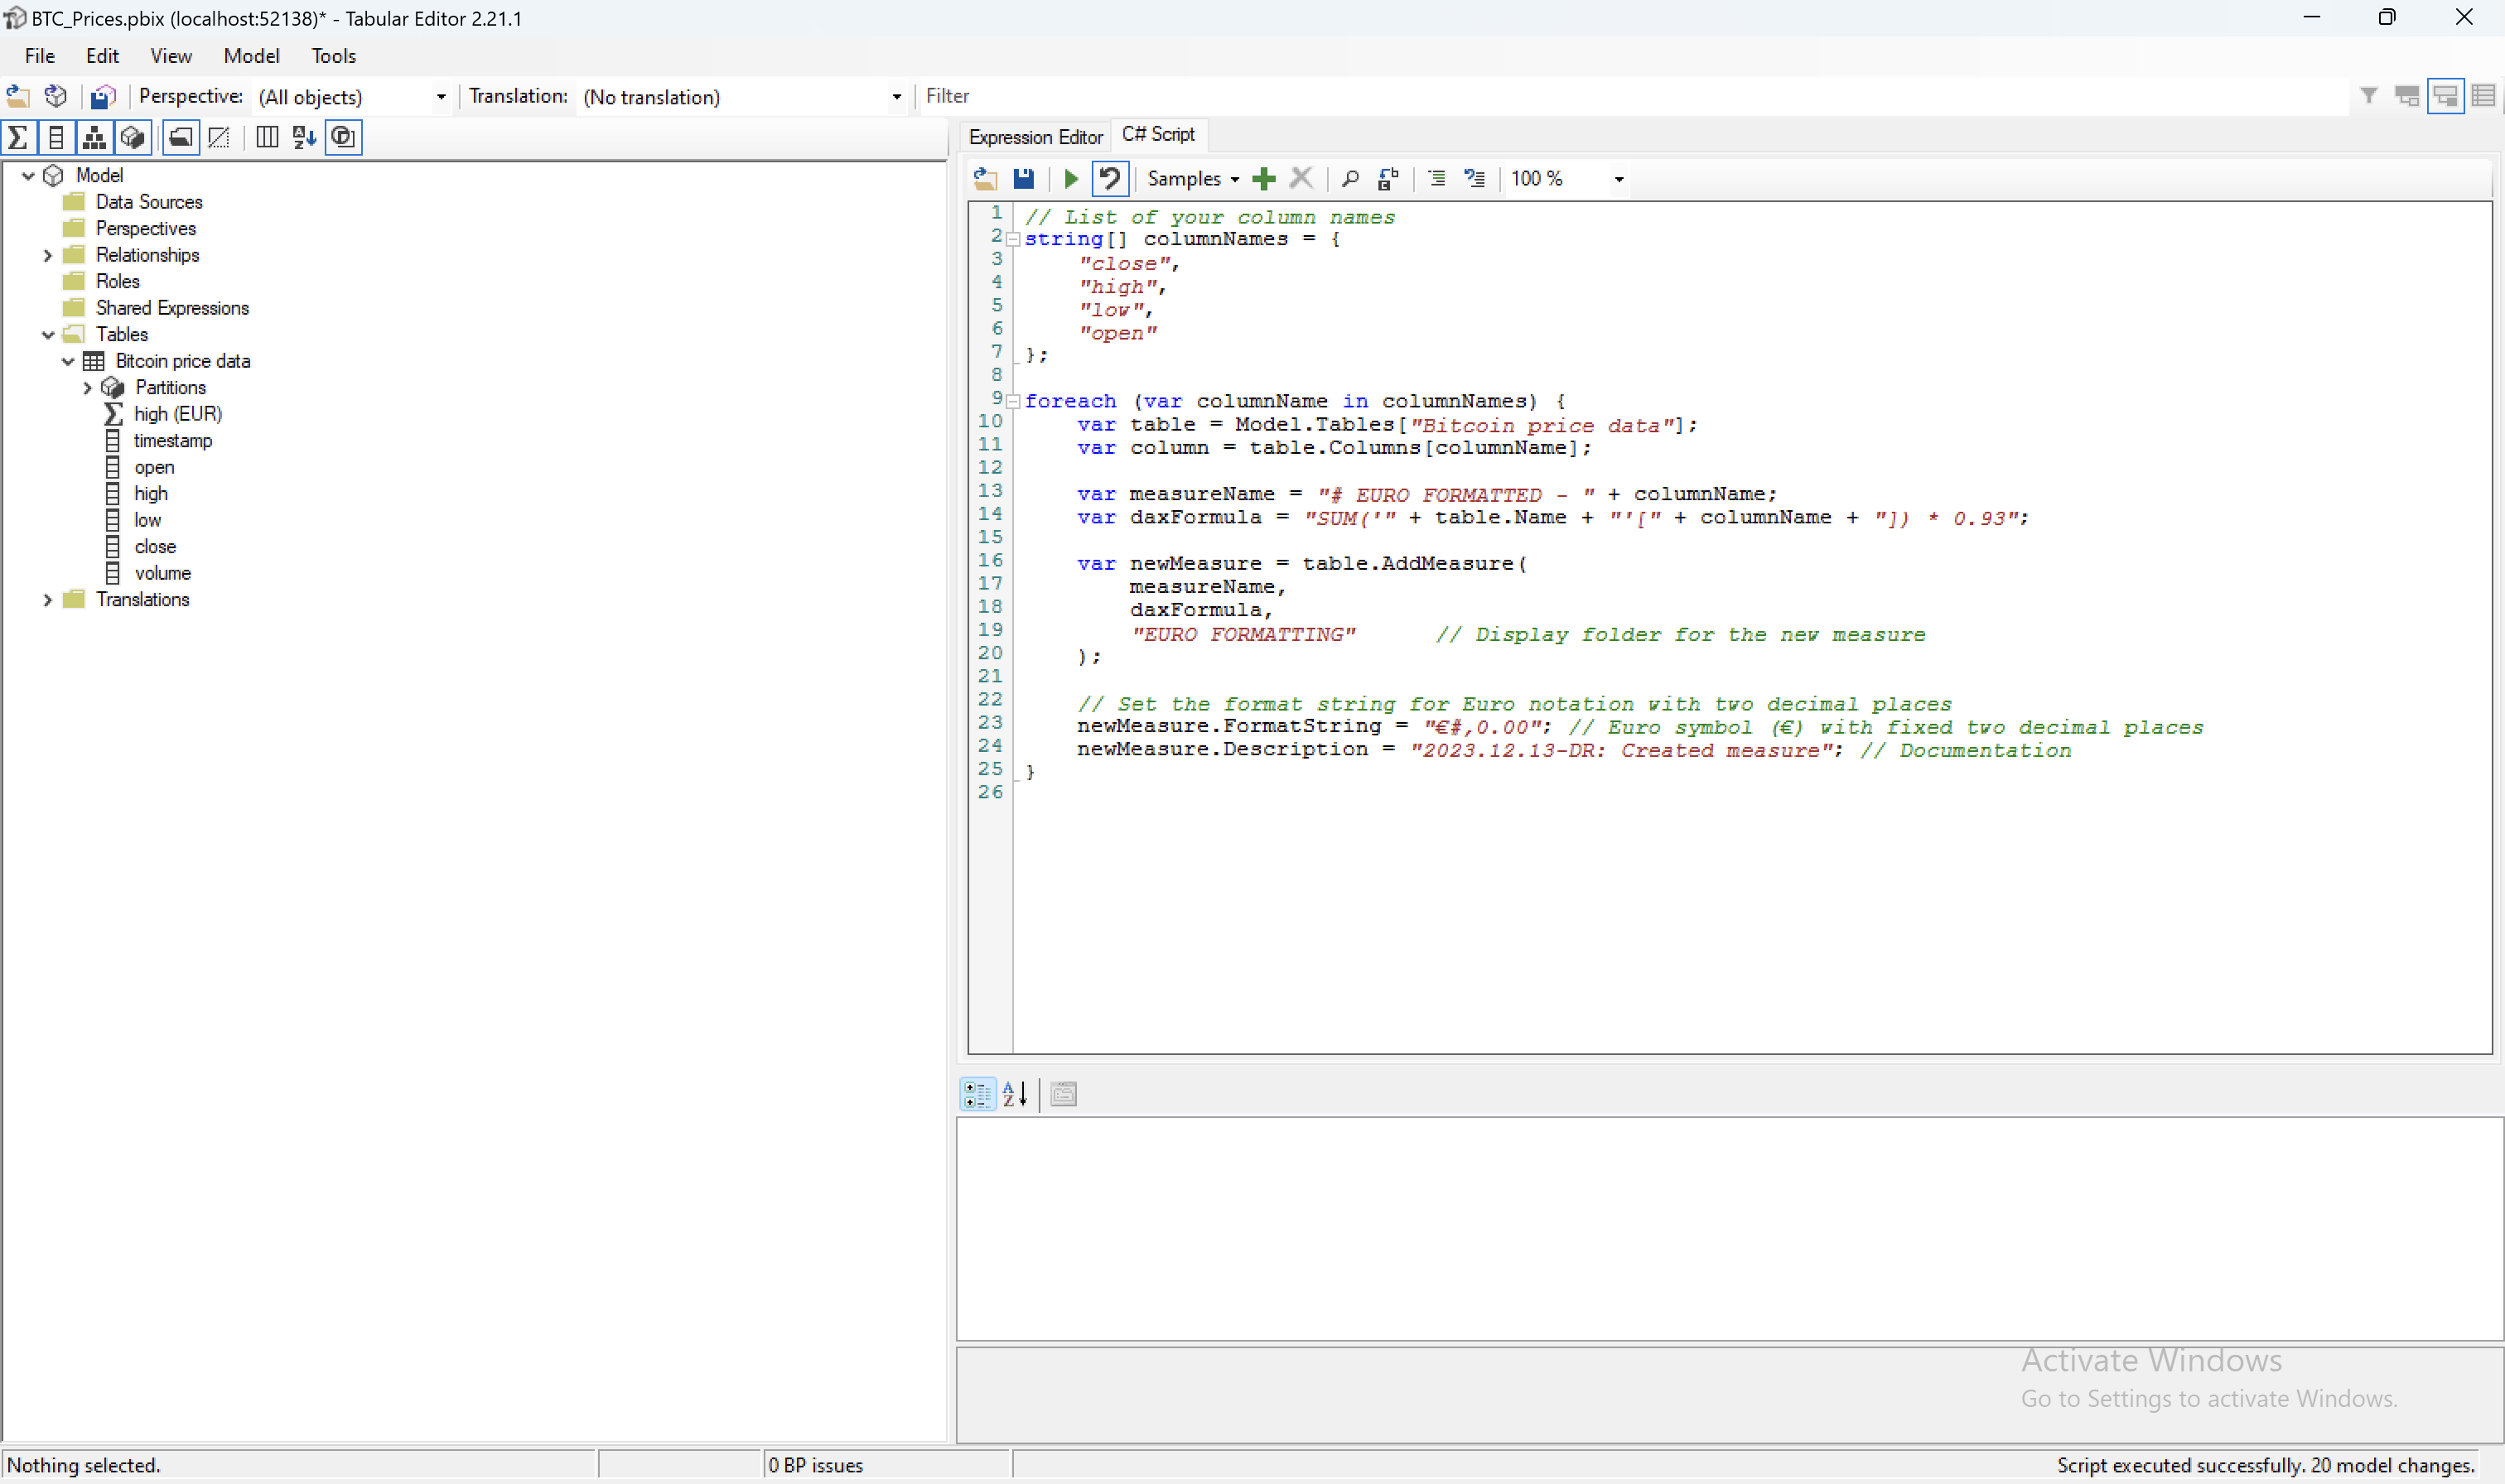
And here's the entire code block:
// List of your column names
string[] columnNames = {
    "close",
    "high",
    "low",
    "open"
};

foreach (var columnName in columnNames) {
    var table = Model.Tables["Bitcoin price data"];
    var column = table.Columns[columnName];

    var measureName = "# EURO FORMATTED - " + columnName;
    var daxFormula = "SUM('" + table.Name + "'[" + columnName + "]) * 0.93";

    var newMeasure = table.AddMeasure(
        measureName,
        daxFormula,
        "EURO FORMATTING"      // Display folder for the new measure
    );

    // Set the format string for Euro notation with two decimal places
    newMeasure.FormatString = "€#,0.00"; // Euro symbol (€) with fixed two decimal places
    newMeasure.Description = "2023.12.13-DR: Created measure"; // Documentation
}
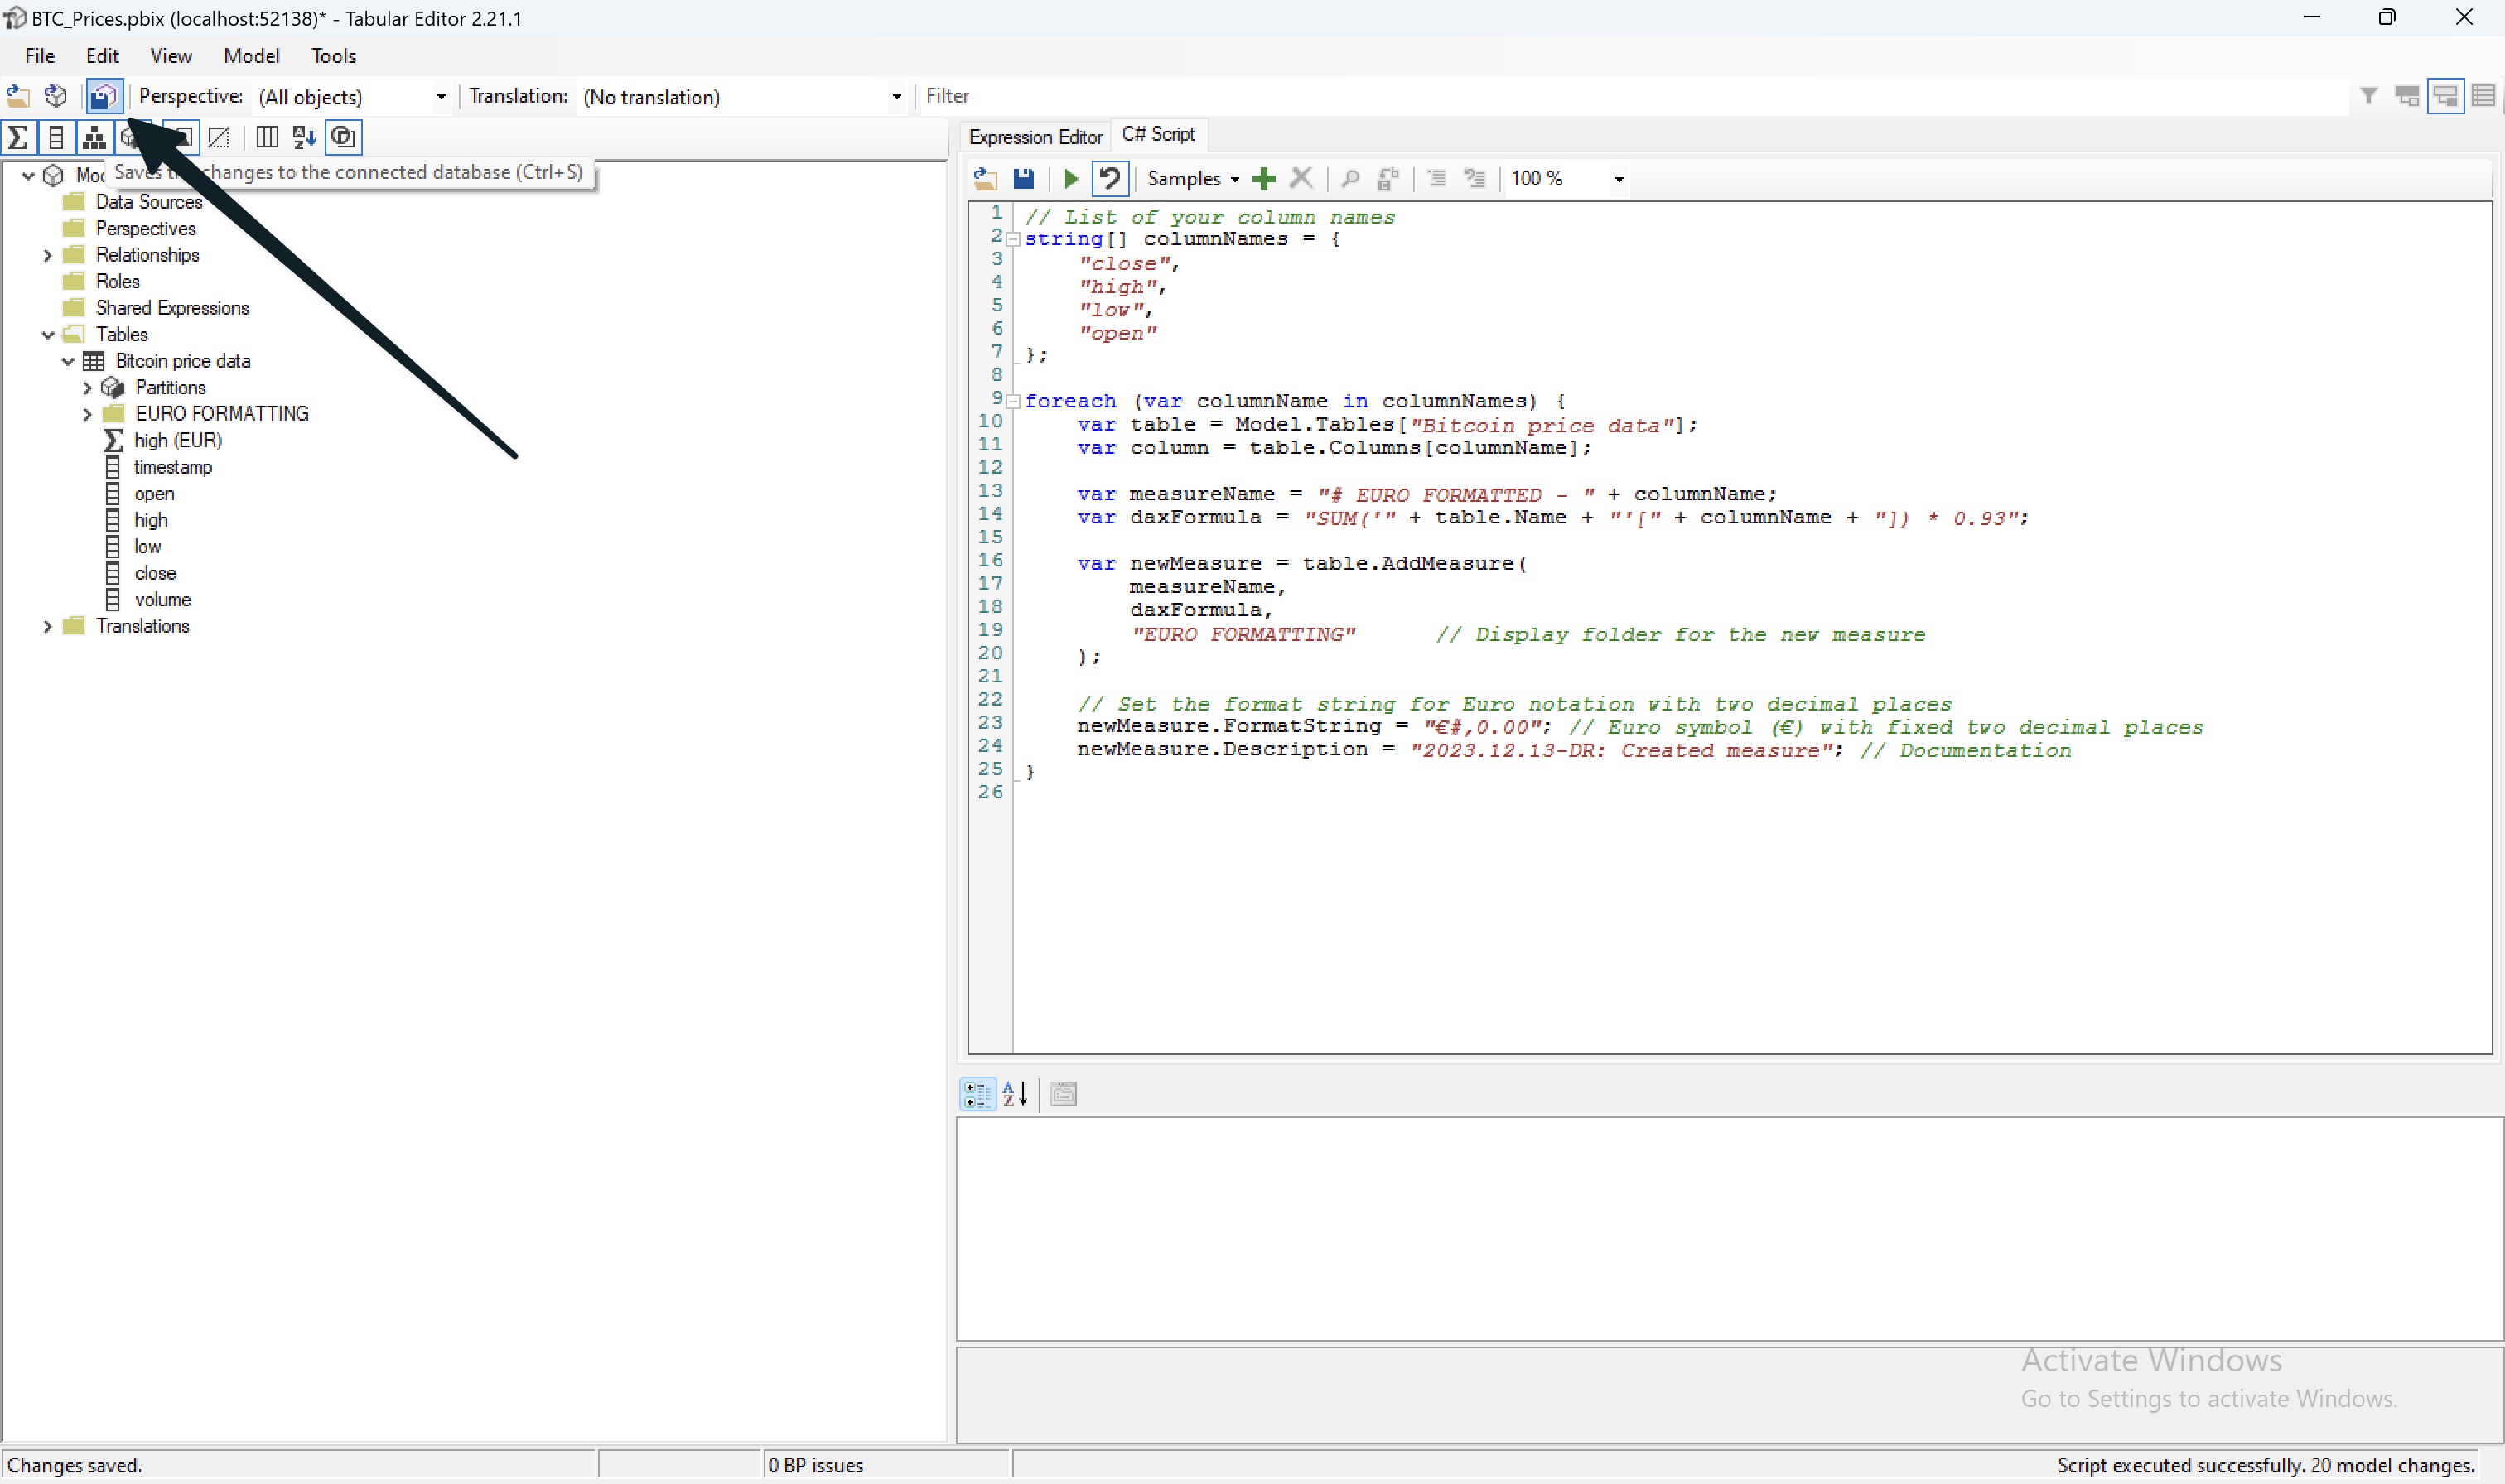
Run the code by pressing this button:

You should see a new folder appear in the navigation bar. Let's save this to our actual Power BI report by pressing the save button:
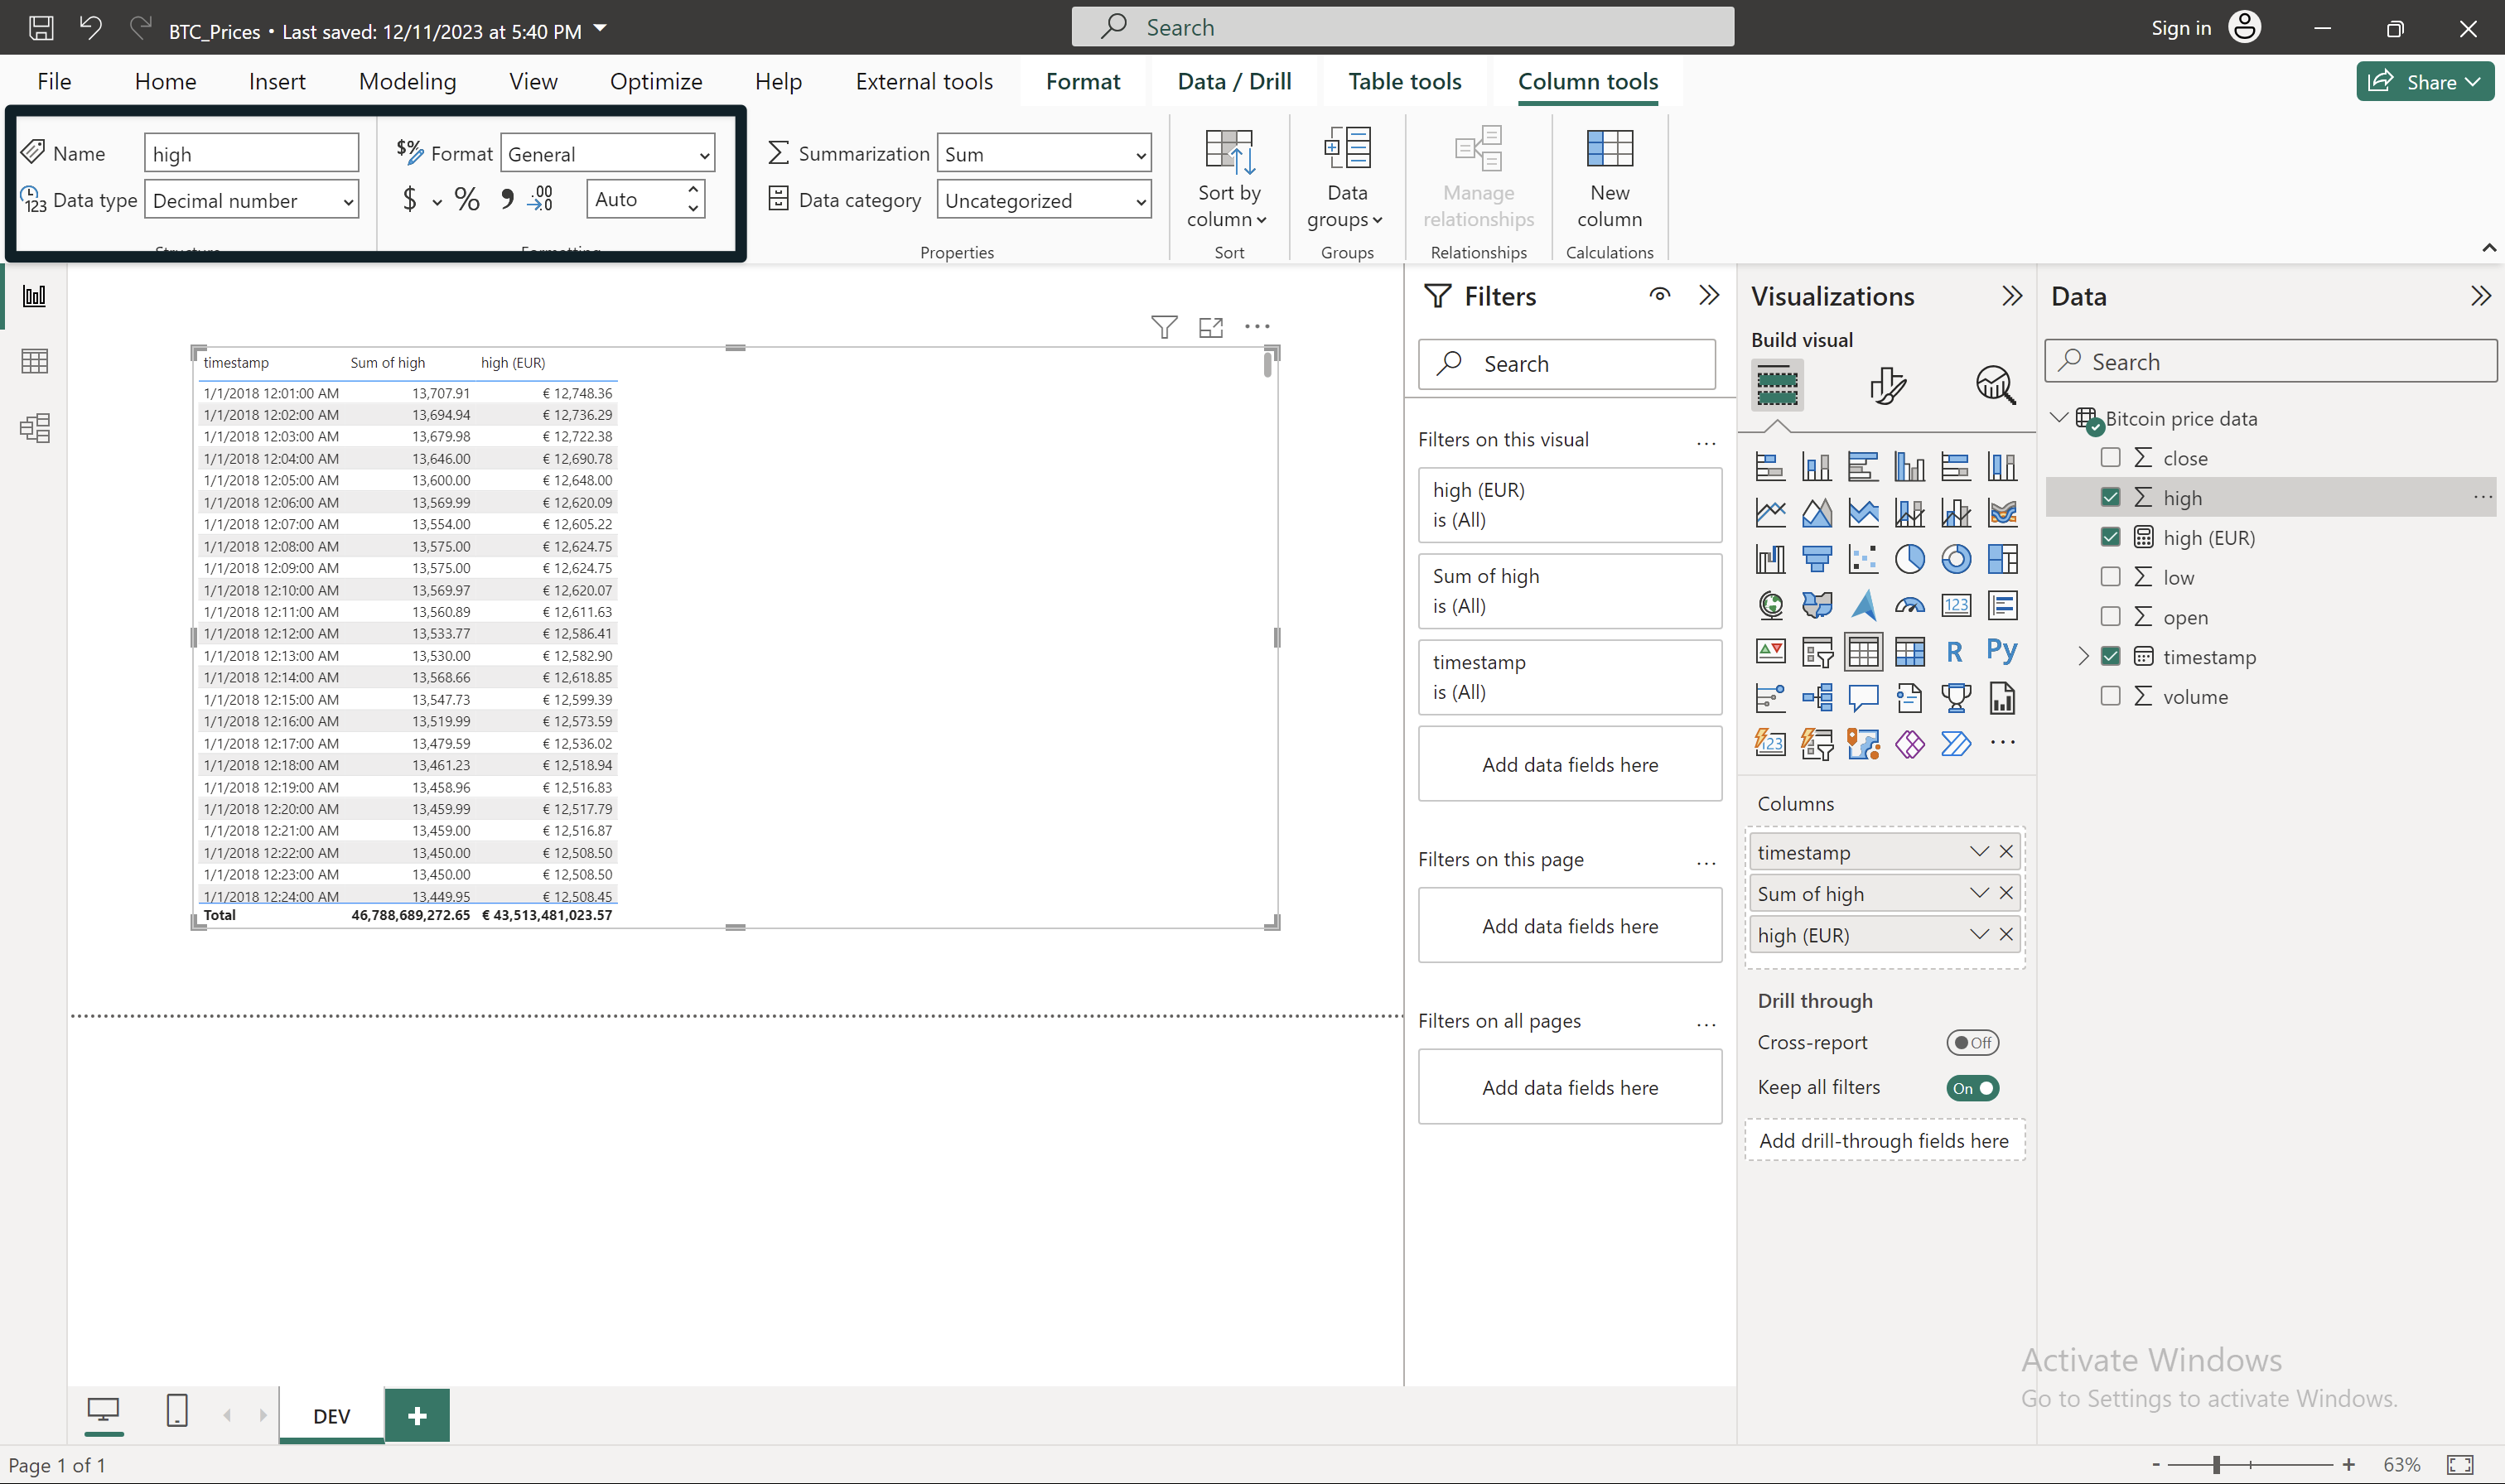
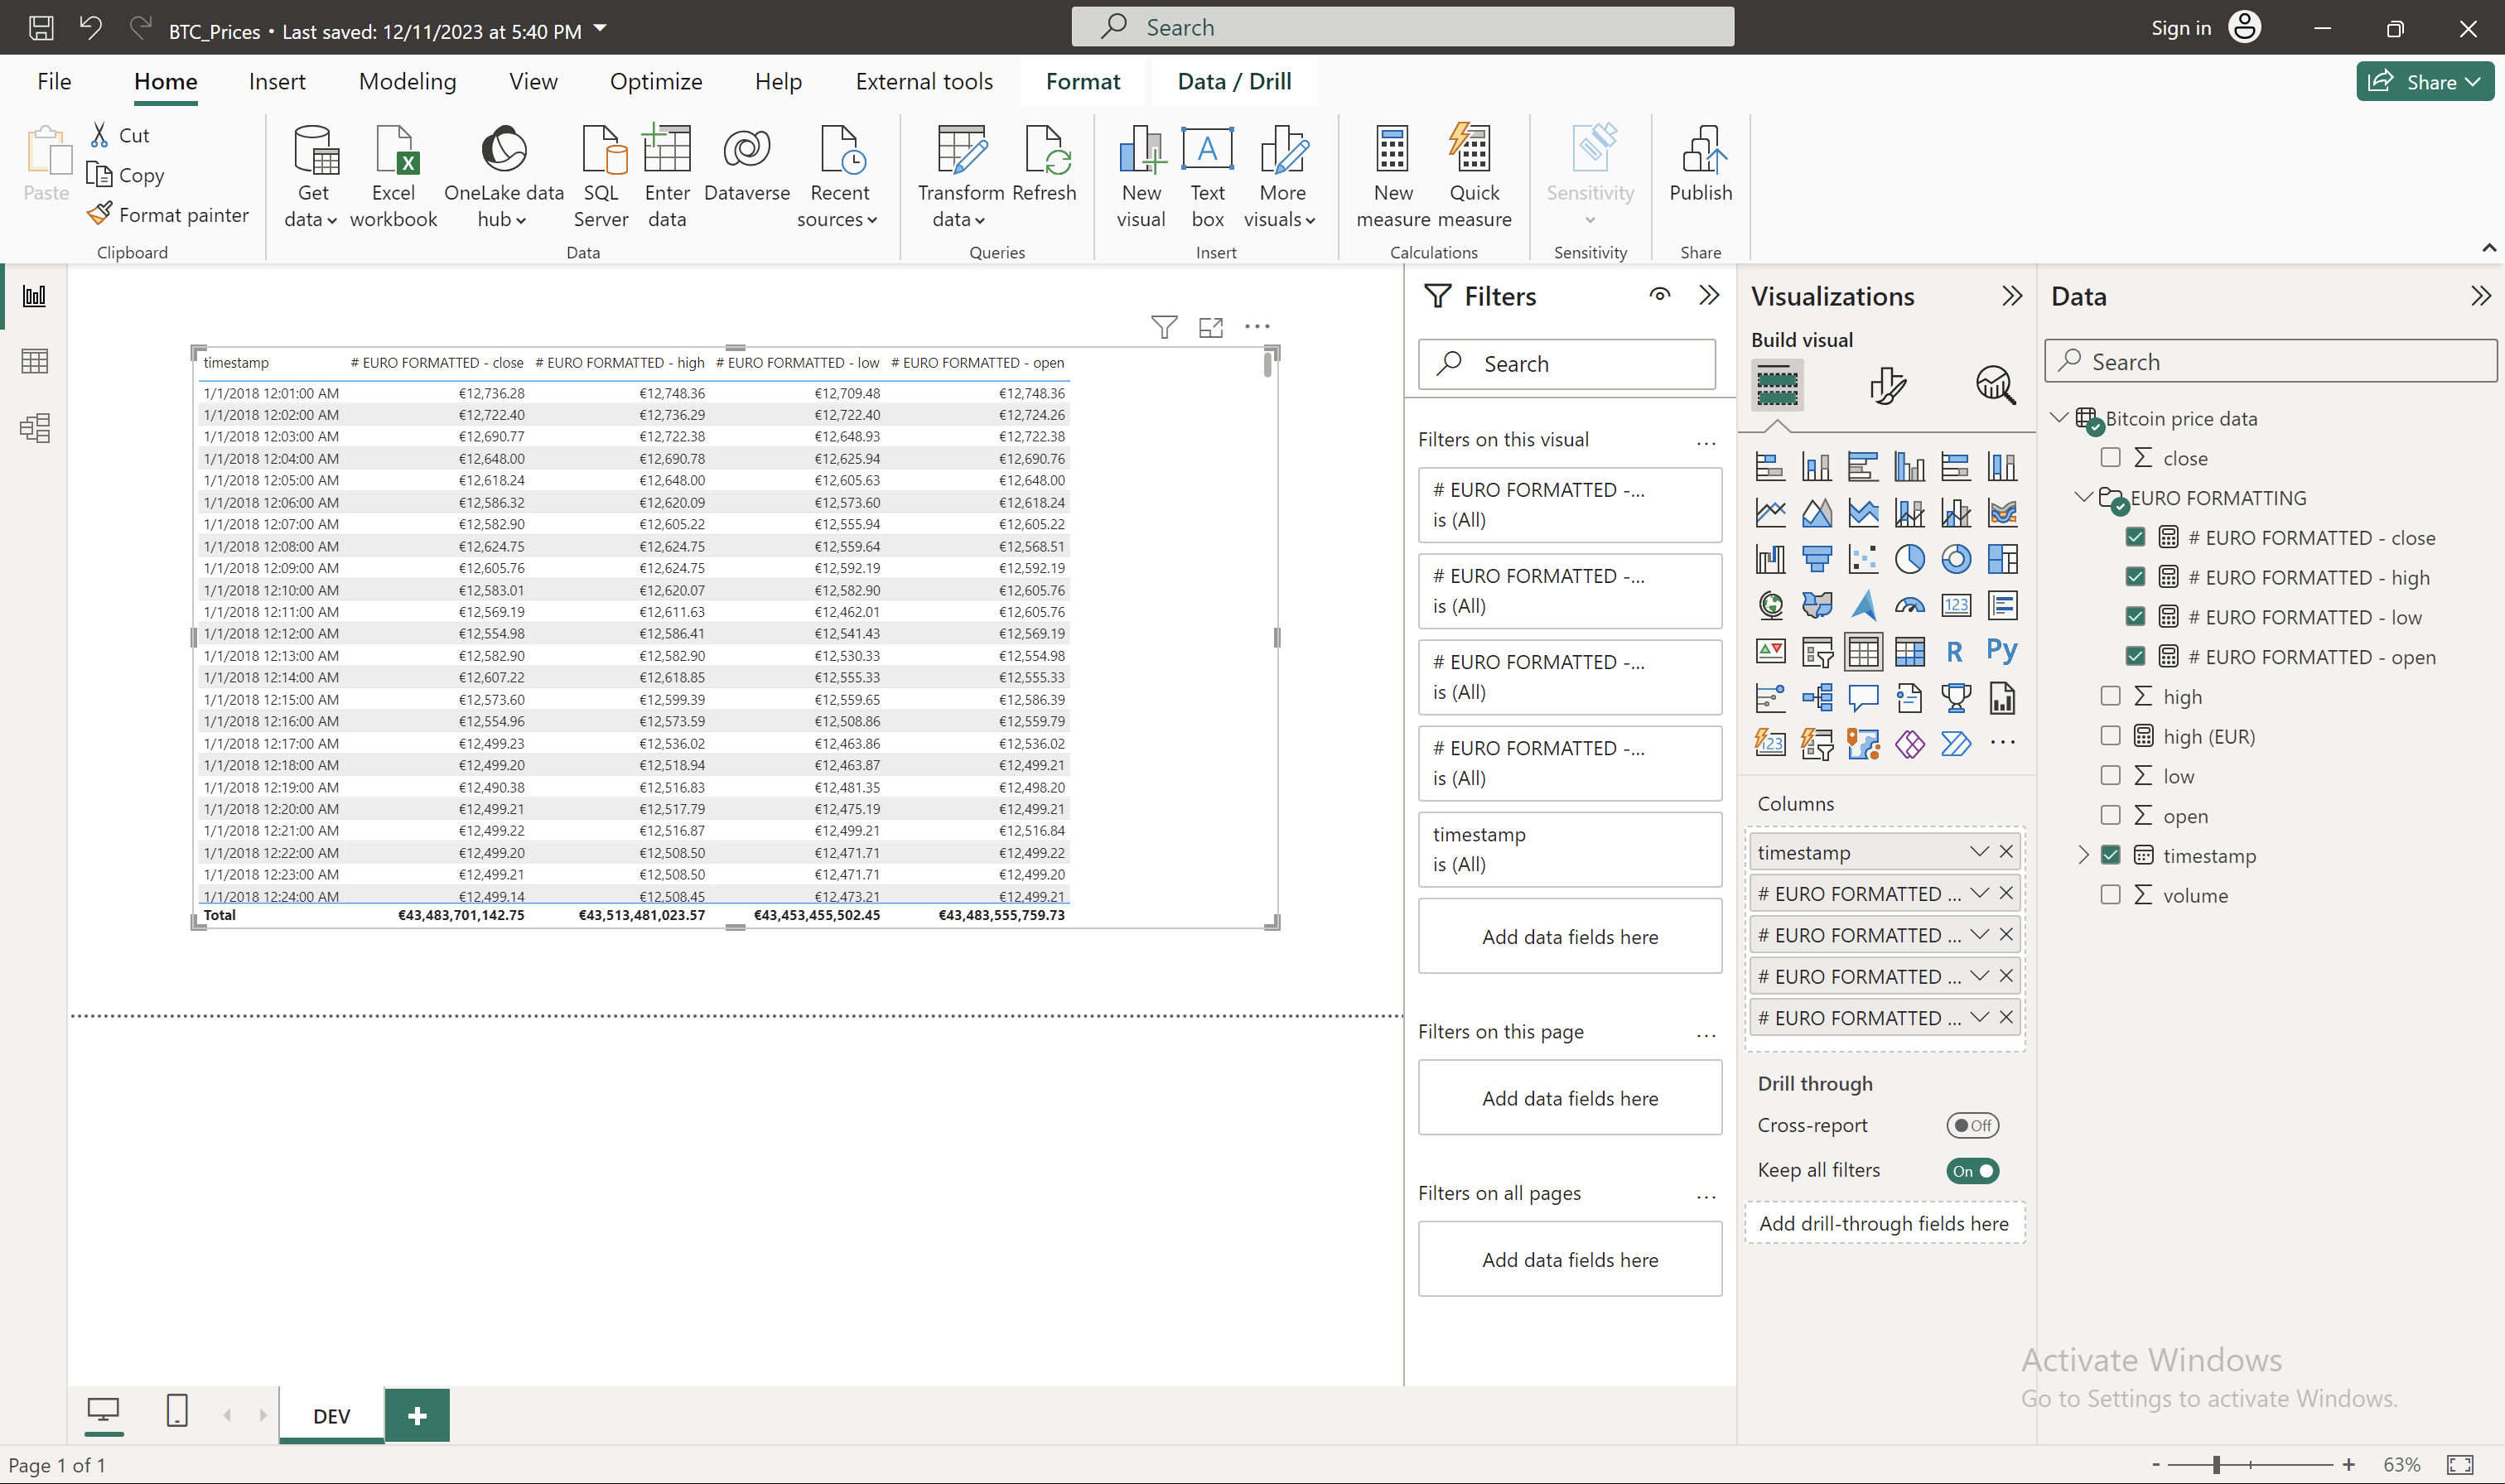
Then head over to Power BI and wait for a few (10) seconds. Your new folder with measures should appear and be ready for use.
As you can see, my ones are finished and work properly in this matrix:
I hope this guide proves helpful. If you encounter any issues, feel free to reach out.
This was an example with only 4 columns, but it could have been 40 just as easily.
By utilizing Tabular Editor, I saved a considerable amount of time and reduced the risk of introducing errors into the DAX measures. I hope you'll be able to start doing the same.
Do you prefer watching to listening? The following video is adapted from this article.